Saturday 26 June 2021

Stitch Classification - Various Types Stitches Used in Garment Making

 In textiles, a stitch is a series of repetitive single turn or loop of threads or yarns through interloping, intra-looping, or interlacing. It is the fundamental element for sewing, knitting, embroidery, crochet, and needle lace-making whether by hand or machine. It can be formed by any of the following three methods:

  • Interloping: It is formed by passing the loop of one thread through the loop of another sewing thread. E.g. Stitch type 401
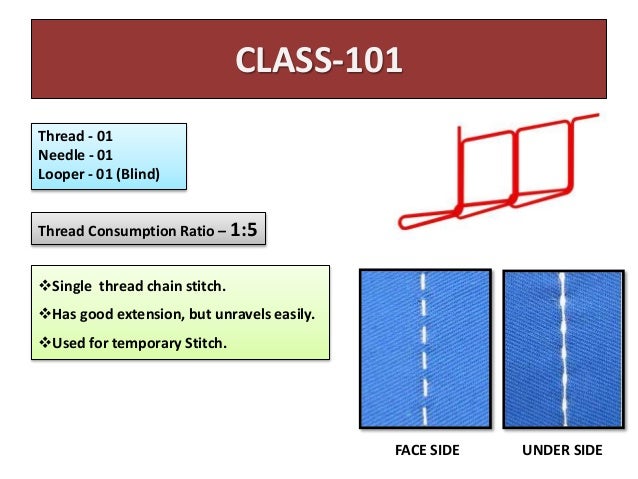
  • Intra-looping: It is formed by passing the loop of one thread through the loop of the same thread. E.g. Stitch type 101
  • Interlacing: It is formed when one thread passes over another thread. E.g. Stitch type 301
Based on this, there are more than 70 types of stitches out of which around 18-20 types are used most frequently and for ease of identification all the types have been grouped to 6 classes based on the number of the needle, direction of sewing, the form or shape of the stitch, purpose of the stitch, etc. The 6 classes of stitch are mentioned as: 

1. Class 100: Single Thread Chain stitch

The stitches formed here are from one or more needle by the method of intralooping. Thus, one or more loops of the needle thread are passed through the fabric and secured by looping with the next loop of the same thread after they are passed through the fabric. This type of stitch is very insecure as each loop is dependent on the next loop and a single thread breakage can pull apart the entire stitch.

These look similar to that of lock stitch on the face side with the loops on the back. The added advantage of these loops is that it makes the stitch elastic and thus can be used where the fabric needs a little stretch such as in back neck tape in t-shirts. Also, with easy removal of stitch, it is used in basting operations in tailor-made garments. This kind of stitch is often not preferred for seaming operations but is widely used in multi-needle machines, as temporary stitch and blind stitch. 

Stitch type 101 or single needle chain stitch is the most common of them along with a 103 single thread blind stitch. The front and back of all the other types are given below 
STITCH TYPE & THREAD CONSUMPTION 

2. Class 200: Hand Stitch

These types of stitches are hand stitches that are used for decorative purposes. These are formed by a single sewing thread and the stitch is held by a single line of thread passing from one side to the other side of the fabric. This is mostly used for casual fitting with a simple sewing needle and thread as domestic needs but is also found as topstitch in high-priced garment due to its perfect finish. This can also be done on automatic machines called pick stitch sewing machines but are very slow and are rarely in use. The front and back of all the other types are given below.  
Basic Textile : Features of Stitch class 200 , its Types , Advantage &  Disadvantage and Uses 


3. Class 300: Lock Stitch

Lock stitch is the most common form of stitch in ready-made garments and is formed when the thread or threads are introduced from one side of the material to interlace with thread or threads introduced from the other side of the material. The top thread is called the needle thread and the bottom thread is called the bobbin thread. The interlacing of the threads makes the stitch secure and difficult to unravel makes it the most appropriate for a wide range of seams. Also, lockstitch has adequate strength for most purposes with a correct combination of thread and fabric.
 
The main disadvantages of lock stitch are
  • Limited bobbin thread length makes it necessary for changing of the bobbin from when it gets finished.
  • Multi-needle stitching with many closed space needles is not possible due to limited space for bobbin. So, at most two needles can be used in a lock stitch machine.
  • The interlacing of thread limits the elasticity of the stitch and is unsuitable for edge neatening.
  • It is not suitable for knitted fabric due to lack in elasticity.
Stitch type 301 is the most common type of stitch with uses in joining garment components, top stitching, etc. Also, buttonholing, button attaching, blind stitching falls in this class of stitches. The front and back of all the other types are given below.  
Lockstitch - Wikipedia 


4.Class 400: Multi-thread Chain Stitch

It is a multi-thread chain stitch type where loops formed in one set of sewing thread is passed through the fabric and are held by interloping and interlacing with loops formed by another set of threads called the looper threads. It looks like that of a lock stitch on the front side of the fabric but has a double chain effect created by the looper thread on the backside. Compares to lock stitch, a 2-thread chain stitch is much stronger and since no threads are interlocking with each other within the fabric there are lesser chances of having a puckering in the seam. Another advantage of this is that both the needle and looper thread runs from large cones on the top of the machine unlike that of the limited sewing thread inside bobbin. Also, it runs much faster than that of a lock stitch machine at 8000rpm. 
Stitch type 401 is the most common of them all and is used in sewing jeans and trousers and is also used with over lock as a safety stitch. Stitch type 406,407 are used for joining lace, braid, elastics with the garment. The front and back of all the other types are given below.  
                           This is a 401 chain stitch located on the outside seam of a pair of jeans.  This stitch has a high speed of production, and is more ext… | Chain  stitch, Stitch, Seam 

5. Class 500: Over-edge Chain Stitch

It is mostly known as overlock stitch and is formed by one or more sets of sewing threads with at least one set of thread going around the raw fabric edge. All the stitch in this class has high elasticity which does not unravel on thread breakage. Also, the machines are equipped with a trimming knife to make the edge neat before sewing. The width of the stitch may vary from 3-5mm. Overlock stitches are classified according to the number of threads used for sewing such as 1,2,3,4 or 5 thread stitches. Each of these stitches is different in appearance and their respective benefits are:
  • 1 thread overlock stitches are used for butt-seaming.
  • 2 -3 thread overlock stitches are used as edge neating seam in woven and knitted garments.
  • 4 thread overlock stitch also known as mock safety stitch provide extra strength while retaining flexibility.
  • 5 thread stitch has two needle threads known as safety stitch which forms stronger seam.
Also, the speed of the overlock machine is similar to that of chain stitch machines and can go up to 8000rpm. Stitch Class 504(3 thread overlock) is the most common of all and is used for securing the raw edges of the fabric and for heavy fabric such as denim 514 (4-thread mock safety) is used. This is because 3-thread stitches are prone to seam grinning when the seam is pulled at a right angle to the seam. The front and back of all the other types are given below. Class-500 (Over Edge Stitch) | Types of stitches, Stitch, Edge stitch 
 

6. Class 600: Covering Chain Stitch

It is mostly known as Flat lock stitch and is formed by three sets of sewing thread namely, needle, looper, and spreader. Apart from the needle threads, the other two sets cover the top and bottom part of the stitch. It is the most complicated of all types with up to a total of nine threads including four needles and rest looper and spreader thread. 

These are mostly used for attaching tape, lace, braid, elastic to the knit fabric, etc. It can also be used as a decorative stitch. Stitch type 602 is mostly used for the above functions and hemming in t-shirts. The front and back of the rest are given below.  
Stich n sesm types with description 
 
 
Stitch classification may not be of so much importance when it comes to knowledge but a clear understanding of it is very much important when there is a requirement of identification of stitching to be done in the garment especially in the tech pack. The stitch type then acts as a code at letting the reader know what stitch has to be done over that part of the garment.    


Collected by: Md. Tarikul Islam Jony
Mail:jonytex073@gmail.com
+8801912885383


Sunday 20 June 2021

Lean Manufacturing tools series 19 (Six Sigma)

 Six sigma is the strategy concerned with reducing the amount of variation concerned with completing a process on a repeated basis, so that the overall product can function at a level that is acceptable to the customer. It is also the practice of constant improvement by identifying defects that can be brought under control in order to improve the functionality of the end product. While it may seem like six sigma is a highly technical skill, in reality it is used in many different sectors. It is not uncommon to see six sigma practices implemented into marketing, sales, and customer support organizations as well.

 Initially created and implemented by Motorola, most companies have implemented some sort of version of a six sigma program in most of their departments. There are some companies that even require all personnel to be trained in six sigma implementations and policies. It uses statistical methods integrated with quality and lean processes to measure the possible and recognized improvement in the process. If implemented properly, entire teams and sub organizational structures (i.e. black belts, green belts, etc) are implemented to guide personnel in the proper conduct of the six sigma process and bringing the culture to the workplace successfully. 

The idea behind six sigma is revealed in the name of the process… through identification of sources of variation and cost, teams are formed to find what the sources are, and then the variation is measured and plotted. It is then analyzed to see if there are other, uncontrollable aspects of the data that may be effecting the way that the parameter is measured.

 All of these are taken into consideration, and then the corrective action that is supposed to bring the process to within six sigma of the target value is implemented, or in other words, the process is improved. Over time, the process is conducted with the corrective action in place, and the parameter, once again, is measured. 

This measurement is plotted, just as it was prior to the corrective action implementation, and the corrective action is analyzed for its effectiveness. The team then discusses what actions can be implemented to ensure the quality improvements are maintained and the progress is not lost by a lack of control over the corrective action. 

The beauty of six sigma is that it can be used in any application, in any business, at any time. As stated before, there are plenty of documented case studies that show how six sigma can be effectively used inside of everything from sales and marketing to very complex manufacturing procedures. With the proper training and teams in place, the sky is the limit with regards to the amount of improvement an organization can realize by implementing the six sigma infrastructure.


                          Figure 1

As can be seen in Figure (1), there are five basic steps to completing a six sigma project. The first is “Define”, in which the parameter in that will be the focus of the project is identified. Additionally, the impact to the bottom line of the business is discussed and the potential savings is measured. It is at this point in which the company will decide whether or not to pursue further action in the improvement of the parameter, and whether the time and funding spent toward the improvement will pay off in the end. 

Next, the parameter is measured in the “Measure” phase. Statistic relevance is taken into consideration as well as other sources of variation such as gage error. It is determined how well the actual parameter can be brought under control by measuring it with respect to the sigma value of a normally distributed curve. 

Take, for example, a process that has 1000 opportunities for a defect. Of these opportunities, 2 defects emerge. This obviously means the process has .002 DPO, or defects per opportunity. From that, we can figure out what our DPMO, or defects per million opportunities. To do this, we simply multiply the DPO x 1 million. Our process has a level of 2,000 DPMO. This means that for every million pieces of this product we produce, 2,000 of them will be defective.

From the DPMO and our DPMO/σ table, we find that our σ value is 4.37. By looking at Figure (2), you can interpret this to mean that you will have a 99.73% chance of having between 1,987 (-3σ) and 2,014 (+3 σ) defects for every 1,000,000 parts produced.


                                           Figure (2)

Once this is completed, the team comes together and analyzes the data in the “Analyze” phase. If the previous two phases were correctly conducted, it will show where the greatest room for improvement exists, and the corrective actions are identified with the estimated improvement calculated.

Improvement is measured after the corrective action is implemented in the “Improve” phase. This phase is almost identical to the “Measure” phase, but more strong influence is placed on the corrective action‟s impact on the final parameter variations.

Finally, the last stage is “Control”, in which the corrective action is either modified or changed such that a long term realization of improvement is shown. Many times the corrective action is temporary in nature and must be modified to be able to sustain the improvement.

While anyone can be taught to brainstorm and start six sigma projects, it should be noted that without a focused and well trained team, there is a very large possibility for failure inside of the six sigma project. It is recommended that a dedicated team be placed in charge of every project and assist the champion in making the project run smoothly.

Six sigma has been proven to set companies apart from each other with its effectiveness. It is practiced in almost every major corporation and almost always results in a better, leaner, and more proficient company.

Prepared by:Md. Tarikul Islam Jony
Mail:jonytex073@gmail.com
+8801912885383


Wednesday 24 February 2021

7 Basic Tools of Quality Control used in Improving Garment Manufacturing Process and Product

 These are a fixed set of graphical techniques that are used to identify all the issues related to quality and assist in solving those issues. The following are all the seven tools of quality control with examples. 

1. Flow chart

It is one of the basic process evaluation tools that is used to analyse the workflow or the process. It is represented through a diagram that pictures all the steps in the process along with the conditions related to any step. These steps can then be followed to go through the task for successful completion of the objective.

The flow chart maps out the steps as boxes of different types according to their processing order and these are connected with arrows. These arrows are in the direction of completing the process but depending on conditions can take on a different course. This diagrammatic representation thus illustrates a solution to any given model and are also used in analysing, planning, documenting or managing a process/program in various fields.    

Figure- Example of a Flow Chart

2. Histogram

It is a representation of the frequency (count) distribution of data among different groups of a sample or population. It consists of vertical bars of different heights and each bar represents a different group of the data. The height of the bar is determined by the frequency (count) of the group. The key characteristic of the histogram is that it represents categorization of continuous data with each group being of similar characteristics. It looks similar to that of a bar chart but unlike that, there are no gaps in-between bars and area of each bar is proportional to the frequency that it represents

It helps in summarizing the data that has been collected and represents graphical data frequency distribution in bar form to highlight areas of needed attention.
Figure- Histogram


3. Checklist

The checklist is used to collect quantitative or qualitative data in a form (document) in real-time at the location where the data is generated. When the data is in a quantitative form the check sheet is also called a tally sheet. Its simple data recording and representation can be used as a preliminary data collection tool for creating bar graphs, histograms and other quality tools. It can also be used to control quality by quantifying defect by type, location, cause (machine, worker), keeping track of completed steps etc. You can make garment checking reports using a checklist template

The data recorded in the check sheet is recorded with marking marks “check” on it. These checks are ticked in the sheet at different locations in a matrix and each has its different significance. These checks are read by observing the location and number of marks on the matrix. For better understanding the background information of the data it also consists of the five w’s which are
  • Who filled out the check sheet
  • What was collected (what each check represents, an identifying batch or lot number)
  • Where the collection took place (facility, room, apparatus)
  • When the collection took place (hour, shift, day of the week)
  • Why the data were collected.
    Figure- A Check List

    4. Cause and effect diagram (Fishbone or Ishikawa diagram)

    Cause and effect diagram was created by Kaoru Ishikawa for the identification of potential cause (factors) leading to an effect (problem). It is mostly used to map out the potential factors for the quality defect which is leading to an overall effect. Each cause or reason for imperfection is a source of variation. Causes are usually grouped into major categories to identify and classify these sources of variation.

    The first part of the tool requires identification of the problem and the factors leading to that problem. Also, sub-factors are determined if need be by making the factors as a group of subfactors. Then the diagram is drawn with the problem in the centre and the factors affecting it as its root branching out. This creates a highly effective visualization to see all the causes simultaneously and work on them in accordance with their importance.

    There are many chronic problems found in garment manufacturing. You can reduce the occurrence of such chronic quality issues by finding the root causes of the problem. And the root cause can be found through the fishbone diagram.

  • Figure - Cause and Effect Diagram


    5. Pareto Chart

    It a type of chart that consists of both bars as well as a line graph. The bars represent the individual value in descending order while the cumulative total is represented with the line graph. The left vertical axis represents the frequency of occurrence, costs, or other important units of measurement. The right vertical axis represents the cumulative percentage of the total number of occurrences, total cost, or the total of the particular unit of measure.

    It is used to highlight the most important among a large set of factors. In quality control, it can be used to represent the most common source of defects, the highest occurrences of type of defects, frequent reasons for customer complaints etc. These charts can be generated by any spreadsheet programs, specialized statistical tool, online charts generator etc.
    Figure - Pareto Chart

  • 6. Scatter diagram

    A scatter diagram (or scatter plot, scatter graph, scatter chart, scattergram) is a type of plot or mathematical diagram using Cartesian coordinates to display pairs of numerical data with one variable on each axis and look for a relation between them. If the variables are correlated, the points will fall along a line or curve. The better the correlation, the tighter the points will hug the line.

    This is used in different scenarios such as to determine whether the two variables are related, or when there is paired numerical data or when the dependent value has multiple values for each value of the independent variable.


  • Figure - Scatter Chart


    7. Control Chart

    Control charts are a statistical process control tool used to determine whether the manufacturing, quality or other aspects are in a state of control. There is always a presence of variations in a process which cannot be nullified as no process can run in an ideal condition for multiple time. This chart helps in control and identification of such variables. This always has a centre line for the average, an upper line for the upper limit and a line for the lower control limit. The control limits are set for a +-3 standard deviation from the centre line. The points recorded in the Cartesian have to be in between these control lines and any variation crossing the lines are an indication of an anomaly that needs to be checked or corrected.
  • Figure - Control Chart